We’ve covered quite a few items in our Ultimate Guide on BLE Debugging.
Segger RTT is one of those indispensable tools that help you debug faster and understand your code’s behavior in embedded system, and it’s a tool you should rely on as much as possible.
You’ve probably used printf() to debug embedded devices and even host PC code. Segger RTT is just another “backend” for printf’s that is faster. Why do we care?
Because as opposed to a PC running at a few GHz, time spent by the CPU to process anything in an embedded system impacts its behavior. One of the rules of measuring and testing anything is to avoid impacting what you’re measuring. If you’re buffering a lot of data using UART, you’re making the CPU perform a lot of work, especially if you’re not using DMA. There are also other issues such as speed, which means buffers fill up too quickly and you have to accept data loss.
Segger RTT is a fast alternative to debugging that runs over the SWD or JTAG. These are the same debug interfaces you already use, which means that adding them is a breeze – no need for more hardware.
To be fair, Segger RTT uses the CPU to copy (or format the data), but it is often a lot less work and doesn’t rely on Interrupts and additional hardware.
Adding RTT
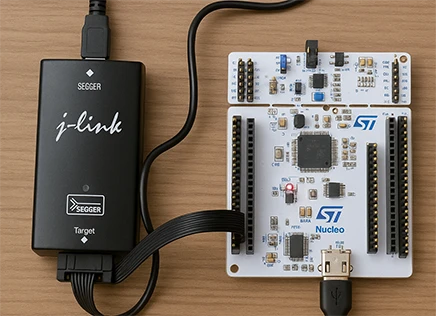
You can add Segger RTT to almost any ARM Cortex target. If it has a Cortex M0 or M33 or similar devices, it will support it. Even when the vendor hasn’t added it, we’ve added it manually. To use it, you need to have a J-Link debugger. Many boards already come with an embedded J-Link debugger, such as the Nordic nRF5x boards. OThers, like STM32 from ST Micro, have a connector that allows you to add a
The first step is to download the RTT sources. If you have installed Segger J-Link, then you already have the sources in
C:\Program Files\SEGGER\JLink_VXYZ\Samples\RTT
Note that XYZ depends on the particular version of the J-Link software you’ve installed. for example, version 8.26 will be located at:
C:\Program Files\SEGGER\JLink_V826\Samples\RTT
Inside the folder you’ll find the Segger sources. You extract those files and you’ll find the following:
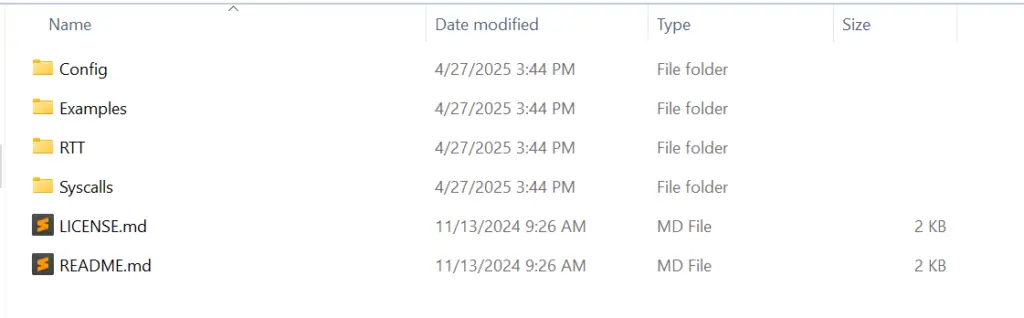
You’ll need to copy the following files to your project:
- RTT/SEGGER_RTT.c
- RTT/SEGGER_RTT.h
- RTT/SEGGER_RTT_printf.c
- Config/SEGGER_RTT_Conf.h
You will need to add SEGGER_RTT.c and SEGGER_RTT_printf.c to the project so it builds as far as the compilation, as well as add whatever folder you put all the files in as part of the include directories.
Initializing and Printing
There’s only one real function we have to call to initialize everything and it’s:
SEGGER_RTT_Init();You can place this function early in main() right at the start. With this Segger RTT is ready. To use it we can call the printf function:
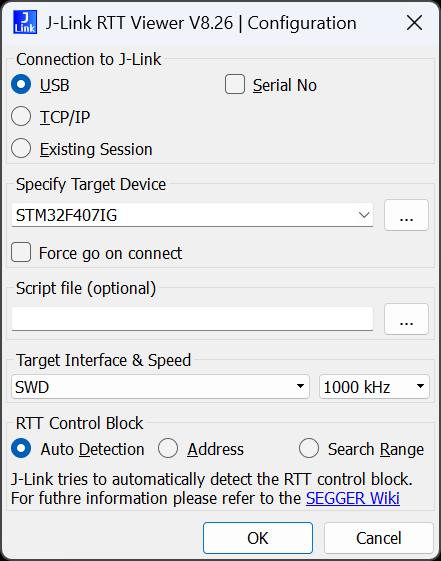
SEGGER_RTT_printf(0, "Initializing System\n");You can now run the code. Before you do that, you need to run the RTT Viewer
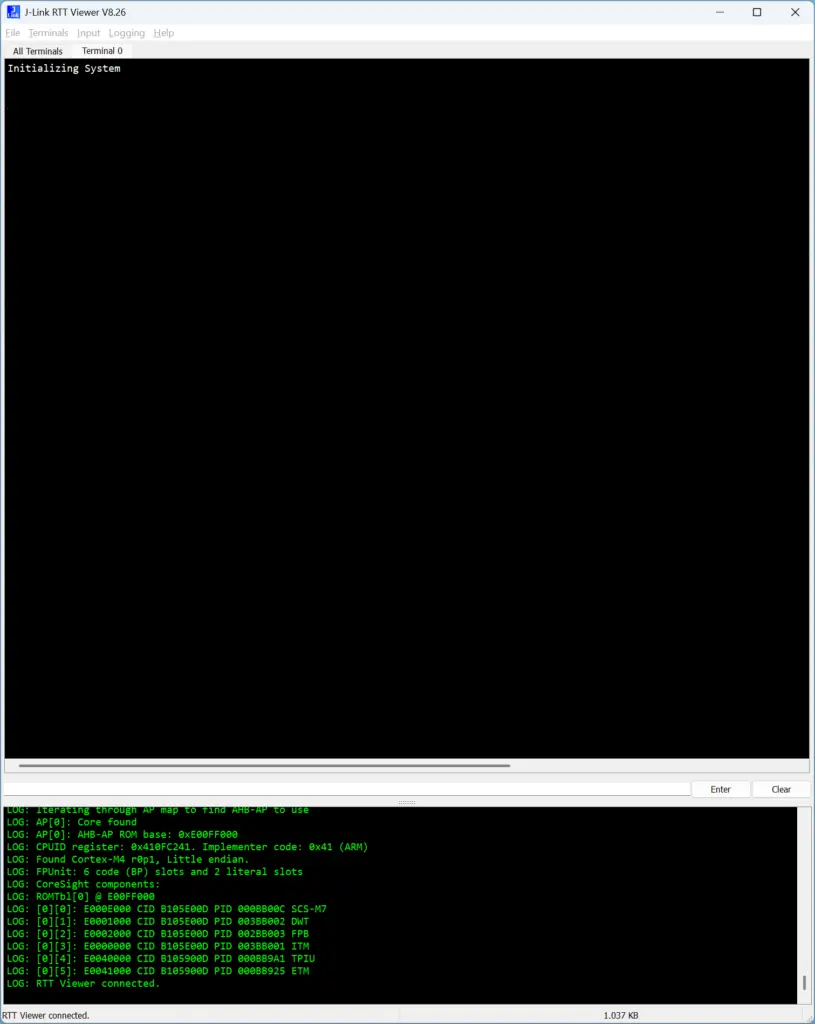
When you start RTT Viewer, the first thing is to connect to your J-Link. To do that, you need to also select the particular ARM Cortex-M part number that you’re connected to. In our case, we’re using an ST STM32F407IG
Getting the Most out of Segger RTT
Getting the basics running was relatively easy. You can now add debug prints or integrate it to your debug logging library. There’s still a few improvements we can make. The first one is that we want to adjust the buffers. There’s a setting that determines the Segger RTT Mode. You can find the configuration in SEGGER_RTT_Conf.h.
Let’s change SEGGER_RTT_MODE_DEFAULT to SEGGER_RTT_MODE_NO_BLOCK_TRIM so that we will get data even if the buffer can’t fit it.
#define SEGGER_RTT_MODE_DEFAULT SEGGER_RTT_MODE_NO_BLOCK_TRIMRTT supports both up and down buffers, meaning you can also send commands to your device and implement a terminal that is processed by the device, just like a UART connection. However, we’ll focus on the upstream buffers.
The upstream buffers are defined by SEGGER_RTT_MAX_NUM_UP_BUFFERS. We usually leave these as is, but you can reduce them.
Most importantly, the BUFFER_SIZE_UP defines the size of the buffer going up, which is 1024 by default. We often go for 4096 or even higher depending on the amount of logs we receive.
// Most common case:
// Up-channel 0: RTT
// Up-channel 1: SystemView
//
#ifndef   SEGGER_RTT_MAX_NUM_UP_BUFFERS
  #define SEGGER_RTT_MAX_NUM_UP_BUFFERS             (3)     // Max. number of up-buffers (T->H) available on this target    (Default: 3)
#endif
//
// Most common case:
// Down-channel 0: RTT
// Down-channel 1: SystemView
//
#ifndef   SEGGER_RTT_MAX_NUM_DOWN_BUFFERS
  #define SEGGER_RTT_MAX_NUM_DOWN_BUFFERS           (3)     // Max. number of down-buffers (H->T) available on this target  (Default: 3)
#endif

#ifndef   BUFFER_SIZE_UP
  #define BUFFER_SIZE_UP                            (4096)  // Size of the buffer for terminal output of target, up to host (Default: 1k)
#endif

#ifndef   BUFFER_SIZE_DOWN
  #define BUFFER_SIZE_DOWN                          (16)    // Size of the buffer for terminal input to target from host (Usually keyboard input) (Default: 16)
#endif

#ifndef   SEGGER_RTT_PRINTF_BUFFER_SIZE
  #define SEGGER_RTT_PRINTF_BUFFER_SIZE             (64u)    // Size of buffer for RTT printf to bulk-send chars via RTT     (Default: 64)
#endif

#ifndef   SEGGER_RTT_MODE_DEFAULT
  #define SEGGER_RTT_MODE_DEFAULT                   SEGGER_RTT_MODE_NO_BLOCK_TRIM // Mode for pre-initialized terminal channel (buffer 0)
#endif
Sometimes there’s a lot of prints, and Segger RTT can’t keep up. If you’re seeing that, there’s a few options:
- Increase the SWD/JTAG speed – the default 1MHz (1000kHz) is good, but you can usually go to 4MHz or even faster. This helps RTT fetch the data faster and provide more throughput
- Increase the upstream buffer – allows the system more time, but increases memory usage and often doesn’t solve the issue
We often have to be tactical in our debugging and enable debug output only for the modules of interest and crashes.
Summary
Debugging embedded systems can be hard because often there’s no monitor and keyboard. Adding Segger RTT adds minimal processing and takes advantage of your existing debugger.